
Tools and metrics
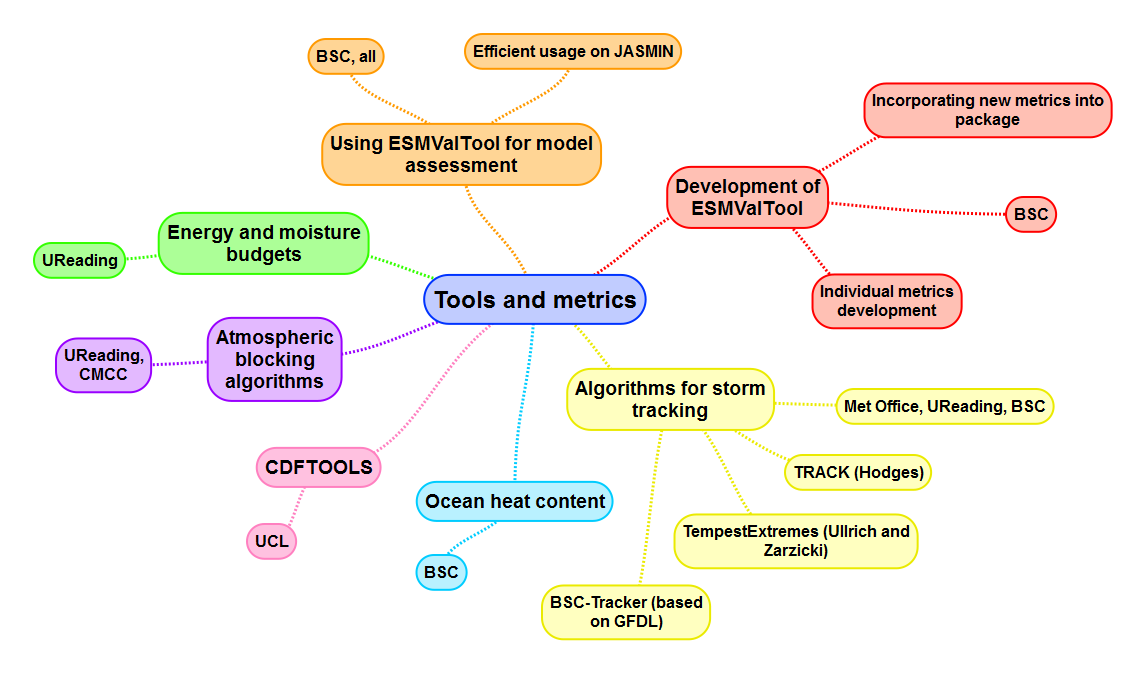
The above mindmap is illustrative of the tools we are using in the project to evaluate models, and hence defining metrics to compare how different models and resolutions perform compared to observations and each other.
Work Packages 10 and 11 are also working with users to explore user-relevant metrics derived from PRIMAVERA’s climate model simulations, to complement the process-driven metrics to better understand both models and their representation of the climate system.
ESMValTool
The Earth System Model eValuation Tool (ESMValTool) is a community diagnostics and performance metrics tool for the evaluation of Earth System Models (ESMs) that allows for routine comparison of single or multiple models, either against predecessor versions or against observations. The priority of the effort so far has been to target specific scientific themes focusing on selected Essential Climate Variables, a range of known systematic biases common to ESMs. The PRIMAVERA project has had the opportunity to join its development since the beginning to ensure that is in line with its needs and, at the same time, to benefit from the strong support coming from other projects. One of the main goals to achieve with PRIMAVERA metrics sharing strategy, is to reach a community as wide as possible. The future deployment of ESMValTool at the ESGF nodes for CMIP6 is a unique opportunity to reach the global climate community. This will allow to maximize the impact and visibility of PRIMAVERA activities and will also benefit each individual partner.
Algorithms for storm tracking
We have several algorithms available for tracking storms (both tropical cyclones and extra-tropical storms) in the models. TRACK (Hodges et al. 2017) uses vorticity to find and track storms on a common grid, and is used for both tropical and extra-tropical. TempestExtremes (Ullrich and Zarzycki 2017; Zarzycki and Ullrich 2017) has been used for tropical cyclones only (so far), but has the capability of tracking many other features. BSC have implemented a tracker based on the GFDL tracker and this can be used for tropical cyclones.
The advantage of multiple algorithms is that we lessen the risk of interpreting one algorithm output in a particular way, when it may itself have strengths and weaknesses (as have the models of course).
Ocean heat content
CDFTOOLS
These are standard tools to analyse NEMO ocean models (which many of our groups use) and make it efficient to generate standard analyses and metrics.
Atmospheric blocking algorithms
Both a one-dimensional and a two dimensional blocking index have been implemented in the ESMValTool by PRIMAVERA. The one-dimensional blocking index is the index used by Athanasiadis et al., 2014. The two-dimensional blocking index implemented here is the absolute geopotential height (AGP) index as introduced by Scherrer et al., 2006.
Athanasiadis, P. J., Bellucci, A., Hermanson, L., Scaife, A. A., Maclachlan, C., Arribas, A., et al. (2014). The representation of atmospheric blocking and the associated low-frequency variability in two seasonal prediction systems. Journal of Climate, 27(24), 9082–9100. https://doi.org/10.1175/JCLI-D-14-00291.1
Scherrer, S. C., Croci-Maspoli, M., Schwierz, C., & Appenzeller, C. (2006). Two-dimensional indices of atmospheric blocking and their statistical relationship with winter climate patterns in the Euro-Atlantic region. International Journal of Climatology, 26(2), 233–249. https://doi.org/10.1002/joc.1250
Energy and moisture budgets
The paper by Vanniere et al (2019) has introduced some initial analysis and metrics to assess the multi-model energy and moisture budgets.
Ocean transports of mass, heat
The author has implemented some ocean diagnostics to look at models in the same way as observations at the 26.5N RAPID-MOCHA ocean section in the Atlantic (Roberts, C.D. et al. 2013; Roberts C.D., 2017, RapidMoc). These will help both to measure the models in consistent ways, as well as enabling comparison with these observational arrays.